

This research was issued by Culverhouse’s Center for Business Economics and Research on September 1. Subscribe to CBER’s newsletter here for regular updates and research on the Alabama economy.
Authored by: Nyesha C. Black, Ph.D., Director of Socioeconomic Analysis & Demographics at CBER.
Alabama’s unemployment rate increased by nearly 300% from March to April of this year after stay-at-home orders were implemented to thwart the spread of COVID-19. While this gives us a broad-stroke view of what transpired this spring, it is worth noting that the economic shock of the pandemic affected counties differently. The dramatic variance in unemployment from Q1 to Q2 can be clearly observed in the data visualization below. The graph shows each county’s unemployment rates for January through June as color-coded dots. The unemployment rate peaked in April, among all counties, so those data points were used to sort the counties from lowest peak unemployment rate to the highest.
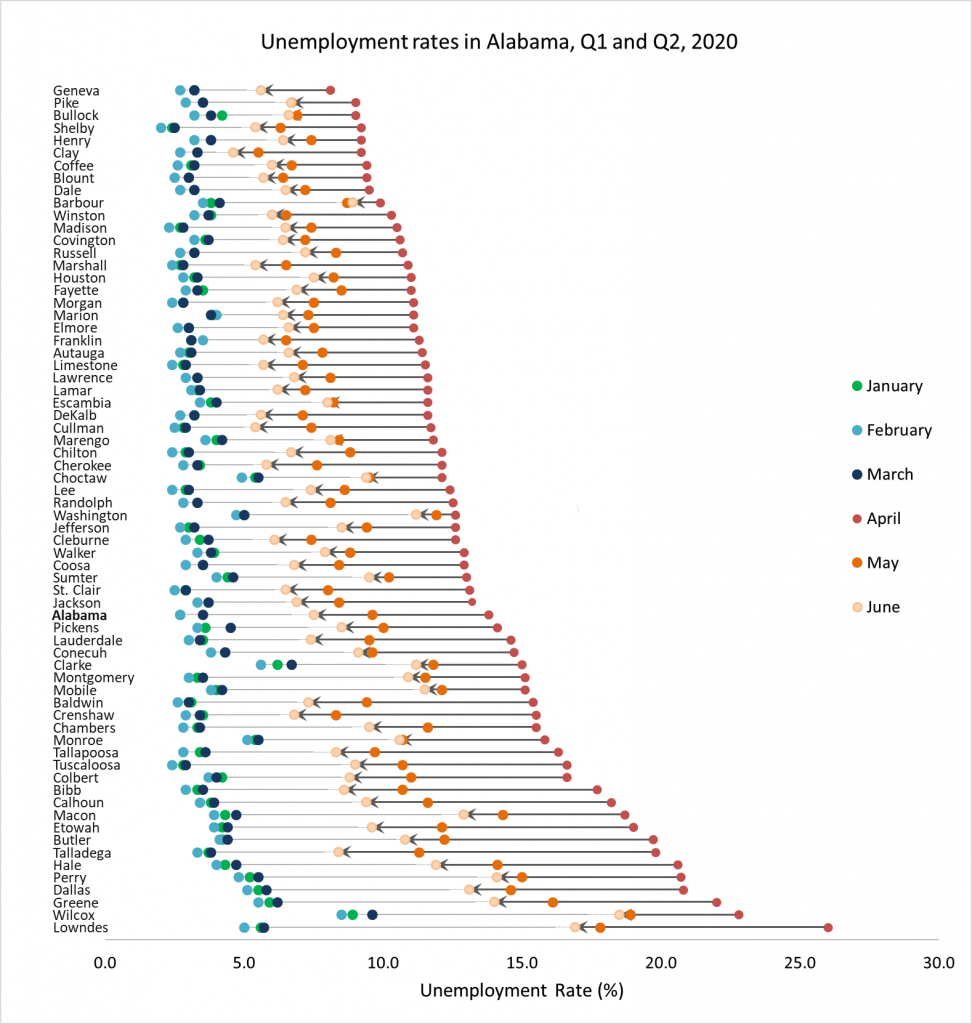
Even before the pandemic, the unemployment rate varied greatly across the state. For example, the average unemployment rate during Q1 ranged from 2.3% in Shelby County to 9.0% in Wilcox County. However, by Q2, the spread was much more significant. The average unemployment rate ranged from 6.4% in Clay County to 20.2% in Lowndes County. It seems as though the differences in the counties unemployment rates were exacerbated by COVID-19. Several counties in the Black Belt already had higher unemployment rates in Q1 and experienced much higher rates in Q2 than counties with lower unemployment rates in Q1. In April, six counties, all in the Black Belt, had unemployment rates higher than 20%.
In June, unemployment rates rebounded, but the rates were still markedly higher, across all counties, compared to the end of the first quarter. By June, no county had returned to the unemployment rates in Q1, but some counties made better progress than others. For example, Clay County had unemployment rates that were the most comparable to March, but the unemployment rate for the county was still 40% higher in June. In comparison, Montgomery County unemployment rate rebounded the least among all the 67 counties, and had rates that were more than twice as high in June compared to March.